Site Map
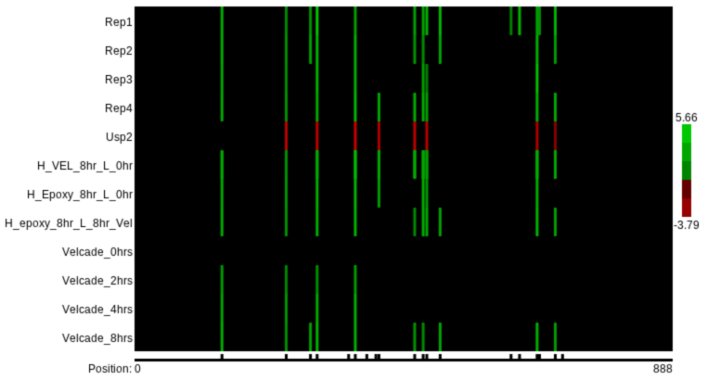
The Site Map provides an efficient and readable illustration of post-translational modifications and associated data along the length of the protein.
Each tick along the bar at the bottom of the map represents the position of a detected modification on the protein. Ticks positioned on the left are nearer the n-terminus of the protein whereas those on the right are nearer the c-terminus.
Each row represents a set of experimental conditions where quantitative information is drawn. Details can be found on the experimental conditions page.
Vertical bars of color show median observed ratio for the condition for the site at that position. Note that the scale of the observed ratios may vary from map to map, and modifications may be detected without obtaining acceptable quantitative data.
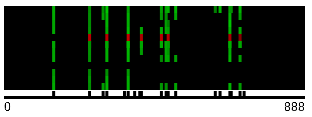
Search results show a condensed form of the site map as a preview to the detailed protein page. The condensed site map shows rows from the set of default experimental conditions and uses the same scale as the larger site map. Note the similarity between the following image and the large edition shown above.